Tropic Modelling of Pulicat Lake Ecosystem & Simulation of Fishery yields
A tropic mass-balance model of the marine ecosystem of the Pulicat lake incorporating energy flows between tropic levels and interaction between trophic components was constructed using the Ecopath with Ecosim (EwE Ver. 5.0) software. The Pulicat model encompassed an area of 350km² and 21 functional ecological groups of which Ecological groupings were made taking into consideration that within group, the species have similar food and similar predators, and they ranged from apex predators like skates, large benthic carnivores and small Bentho Pelagicus to micro zooplankton and detritus. The study period was from2009-2010 and an average picture during this period is presented. The input parameters used for the model fitting were the ecological group-wise estimates of production biomass (P/B)ratio, consumption biomass (Q/B)ratio, biomass, diet composition and fleet-wise and group-wise fishery catches. the quality of the inputted data was assessed with Ecopath pedigree index and the value obtained was 0.521(scale 0-1). The total system throughput represents the size of the entire system in terms of and was estimated for Pulicat lake ecosystem 9894.5 t /km²/year, which is comparatively high, but is consistent with tropical marine ecosystems with high turnover. The Pulicat model had a mean trophic level of 3.02, which the minimum being 1 (phytoplankton) and maximum 4.45 (clupeids). Gross efficiency of the fishery is computed as the ratio between the total catch and the total primary production in the system. For Pulicat model the value obtained was 0.0021(higher than the global average) indicating a fishery harvesting fishes low in the food chain. The Pulicat lake ecosystem is well known as being part where lower trophic level pelagic fishes dominate. The system omnivory index is a measure of how the feeding interactions are distributed between trophic levels. For the Pulicat Lake Ecosystem an index value of 0.248 was obtained. The total primary production by total respiration ratio is considered by Odum to be an important ratio for description of the maturity of an ecosystem. According to Odum’s classification the pulicatlake ecosystem is in a developing stage with ratio being greater than 1(1.356).the estimates of net system production and total primary production by total biomass ratio also indicated that the ecosystem is immature. The predation mortality rates (M2) were considerably higher than fishing mortality rate among the commercially ex ploited groups with respect to cephalopods (Grp 2) , large benthic carnivores (Grp 4), small benthic carnivores (Grp 6), anchovies (Grp 10), crabs and lobsters (Grp 12), shrimps (Grp 13), and benthic omnivores (Grp 14). This indicates the predation pressure exerted on these groups by other groups. The top 3 apex predator groups and tunas had no predatory pressure. The flows to detritus were maximum for phytoplankton and micro zooplankton followed by meiobenthos and heterotrophic benthos. The least flows were observed for apex predators. The omnivory index (OI) was calculated as the variance of the trophic level of a consumer’s prey groups. The maximum OI was observed for group 5 medium benthic carnivores, followed by group 9 clupeids and indicating feeding on a wide variety of preys. Highly specalized feeding (low OI) was observed for tunas and mackerel. Higher consumption was estimated for groups in the lower trophic levels. Maximum was observed for micro zooplankton (1338 t/km²/year).
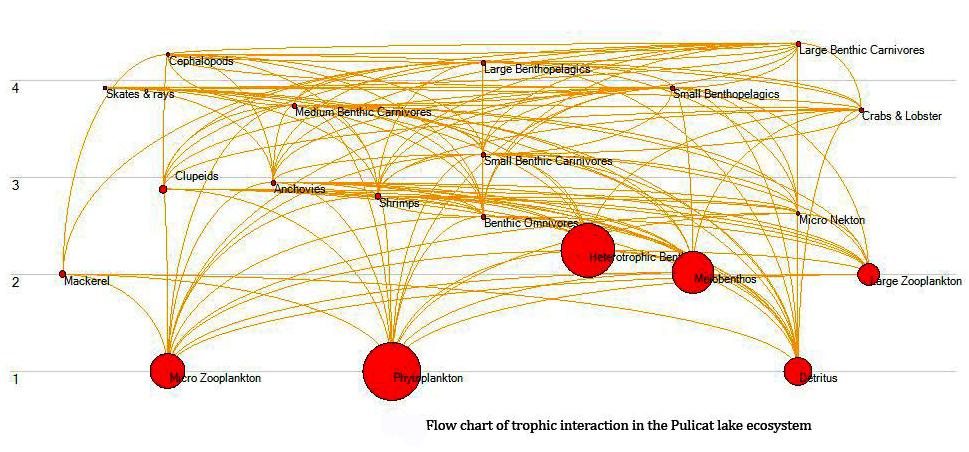 The prey and predator niche overlaps for pulicat lake indicates that tunas, cephalopods and large benthic carnivores have significant overlap in their diets with marine mammals. Maximum prey overlaps were observed for groups , medium benthic carnivores. Similarly, large pelegics and large benthopelagics had significant predator overlaps. Maximum predatory overlap was observed in the case of cephalopods. The selection indicates or electivity describe a predator’s preference for prey and in the pulicat lake pelegics, while it avoided small benthic carnivores and small benthopelagics. Group 5 medium benthic were very selective feeders (on benthic omnivores and large zooplankton) avoiding most prey groups. The search rates (volumes searched per unit time by a given predator j seeking a certain prey i) for groups of the pulicat lake indicated the higher trophic level groups had higher search rates than lower trophic level groups. Maximum primary production required for harvest of groups was observed for group 11 small benthopelagics, group 7 large benthopelagics and group 6 cephalopods. Maximum primary production required for consumption of groups was observed for lowertrophic level groups, viz., micro zooplankton, micro nekton, hertrophics benthos and anchovies. In the pulicat ecosystem higher trophic level groups had large ecological footprints (PPR per unit biomass) indicating that more resources were necessary to sustain their production. The mixed trophic impact analysis indicated that shore seines negatively impact mackerel and clupeids and gill net negatively impact on small benthopelagics . since anchovies are a food organisms for many groups, they have a positive impacts on cephalopods and small benthopelagics. The Pulicat lake ecosystem has relatively low ascendancy (43.5%) when compared to some other self systems. The systems is over head is approximately 56%. This suggest that the Pulicat lake ecosystem has significant strength in reserve and can either be resistant or resilient to perturbations with the capability to bounce back quickly to orginial levels . A trophic flow digram was constructed such that boxes representing organisms low in the food web are placed in the lower part of the graph, while the organisms high in the food web are put higher up. The boxes connected by means of trophic flows.The present ecological model constructed and the simulation made are a premilinary exercise and with the availability of better information and more vigorous data the model can be improved so as to reflect the reality in a better fashion. This study shows that ecological modelling is much better tool for management of multispecies fishery resources and should be applied to other major marine ecosystem in India
 kg) was placed in the tray no 2 with 25 grams of halo tolerant earthworm (Pontodrilus litoralis) (Fig.4). 4th week, total wt of the earth worm increased in maximum (39 g) and started to decline and reached 1 g in 8th week.Interesting observation was Pontodrilus litoralis reached maximum weight and higher number in 28 days and superior to Cymodocea serrulata in terms of weight and number in short days. Syringodium isoetifolium (1 kg) was placed in the tray no 3 with 25 grams of halo tolerant earthworm (Pontodrilus litoralis). Beginning of experiment onwards earth worm Pontodrilus litoralis started to decline in numbers and weight. They were survived upto two weeks (14 days). Mixed (Syringodium isoetifolium, Halophila ovalis and Cymodocea serrulata) sea grass (1 kg) was placed in the fourth tray with 25 grams of halo tolerant earthworm. 3rd week, total wt of the earth worm increased in maximum (31g with 170 numbers) and after started to decline and reached 2 g and 10 numbers in 6th week. Some necessary components in the mixed seagrass might increase the reproduction rate of the worm, Pontodrilus litoralis drastically and simultaneously prevent the weight increase. 170 individuals has been developed through proliferation of Pontodrilus litoralis is the highest record in whole study. Coastal sand was placed in the tray (No 5) with 25 grams of halo tolerant earthworm (Pontodrilus litoralis). They were survived in seven days and found to dead at the end of 7th day. This tray is to know the longevity and life of earthworm without providing the food. Pontodrilus litoralis might survive seven days without food supply. Vermicompost was derived after 60 days. Cymodocea serrulata yielded 500 grams, Halophila ovalis yielded 300 grams and mixed sea grasses yielded 622 grams. However mixed seagrasses yielded high amount, it is properly turned into composit. All essential nutrients were enhanced and pollutants and heavy metals were reduced during the process of verimcomposit. Vermicompost suppress of specific insect attacks by various forms of organic amendments
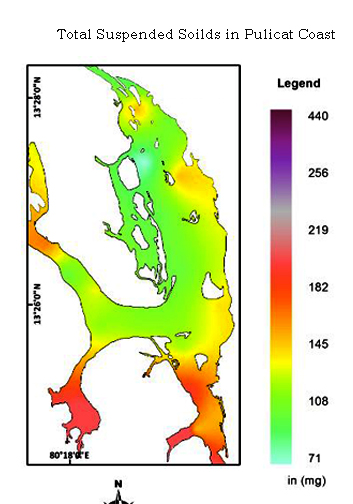 Total suspended solids were measured in the flushing channel of Pulicat between lake and sea. In November 2013, suspended solids were noticed higher in st.7 (241mg/l) lower in St.13 (153mg/l). In December 2013, suspended solids were recorded to be higher in St.1 (436 mg/l) and least level in St. 8 (154 mg/l). In the month of January 2014, suspended particles were higher in St.5 (195mg/l) and lower in St. 12 (72 mg/l). High amount of suspended particles in all stations were observed in November 2013 (4206 mg/l), followed by December 2013 (4060 mg/l) and January 2014 (2197 mg/l). However, in December, 2013 at St.1 to be identified as higher suspended load site (436mg/l). Interpolation contour models showed that suspended load in the month of November
 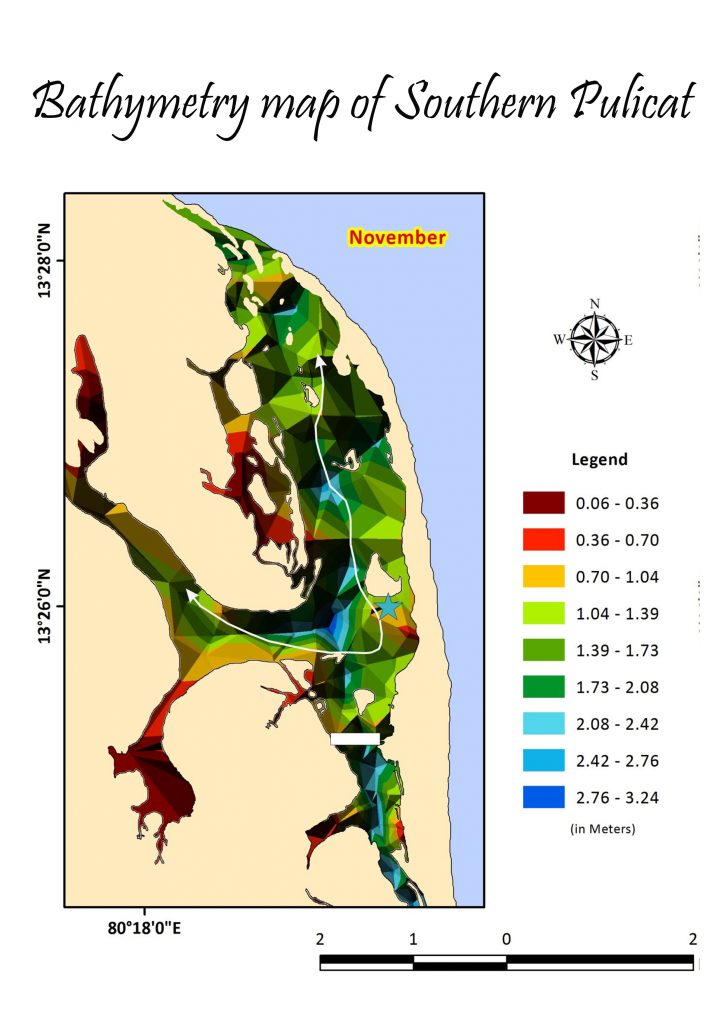 and December (monsoon season) has higher both spatially and quantitatively. Nevertheless, suspended particles in November were higher from mouth to inner lake of the flushing channel and in December, particles were less in distribution but greater in quantitatively in chosen stations. As per the water movement which cause erosion and accretion and particle settlement in the lake, bathymetry being determined. Bathymetry mapping both DEM and interpolation contour models showed that western side of the St 7 found to be higher depth caused by water current induced erosion. Most of the parts in flushing channel of Pulicat noticed as shallow regions. Some pocket regions in Northern and Southern part of flusing channel seems to be high depth which investigated clearly in the bathymery maps. Bethymetry in January showed the reducion of depth might be less water current caused accretion. During November 2013, 30 tonnes of sediments carried by low tide water flushing towards sea and 27 tonnes carried towards lake by high water is the highest transaction (Table 2). Three tonnes of sediment carried into sea by net transport migration. It was reduced in January as 1.5 tonnes. the suspended particle transport was higher in monsoon and reduced in Post monsoon and highly depends on the fresh water run off and river water which carries particle by Kalangi river.
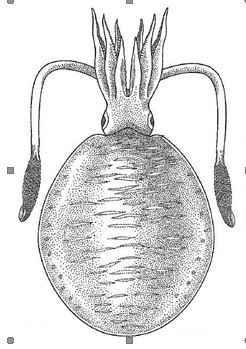 Sepioteuthis lessoniania species were collected in the landing center of Thondi, Palk bay for anticorrosion activity. Ink was separated from the species as by standard methods. Batch of eight coupons made up of steel (1inch and 3 inch) were prepared by series of methods prior to the experiment. The coupons were used in the following order
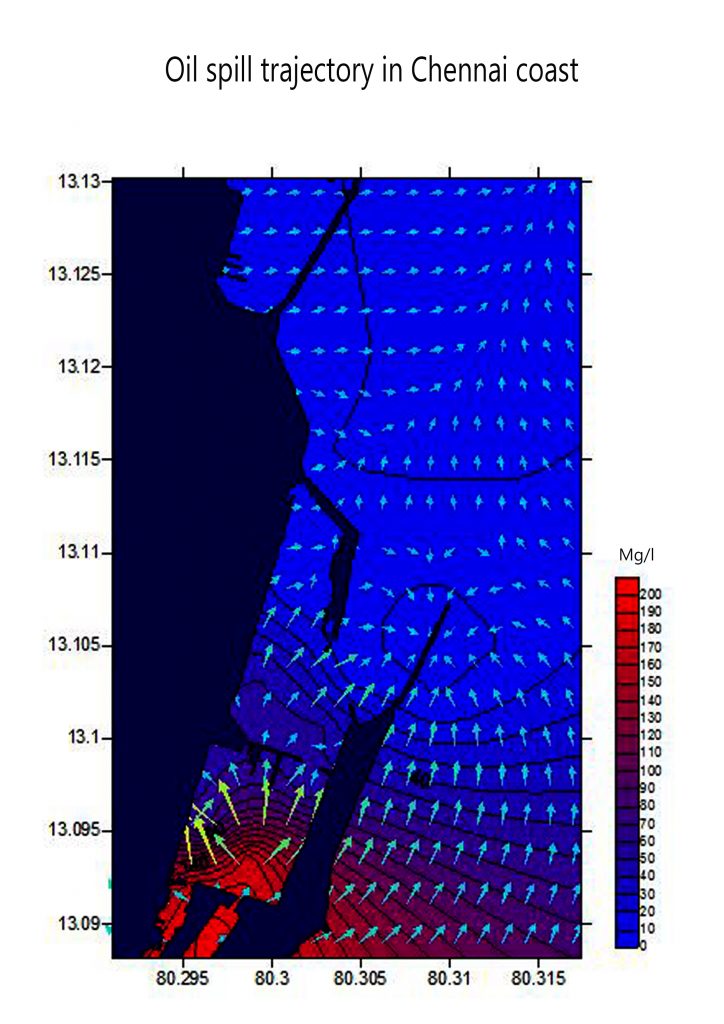 er would be lower inside the harbor. Depth of the harbour was varied from 75 to 1450 cm in the present study. Present study revealed that depth never play major role in the trajectory of spill. Salinity in all the stations was extreme of 31 ppt and lower of 39ppt. Hike was noticed inside the harbor showed high correlation with temperature due to absence of visiting tidal waters caused higher salinity. The pH fluctuated between from 8.1 to 9. The pH recorded fully alkaline. The results showed that one isolates were short Gram Negative rods, Pseudomonas and coma shaped negative rods vibrio and the other isolate were Gram Positive cocci , Staphylococcus sp. The colonies Golden yellow colour colonies were observed in mannitol salt agar. Gram positive cocci in clusters were observed in Grams staining. Nutrient agar-Pseudomonas – Green colour colonies were observed. Gram negative short rods were observed in Grams staining Tcbs – Vibrio – Yellow colour colonies were observed. Comma shaped gram negative rods were observed in Grams staining.18 species were diatoms (Bacillariophyceae), 8 species were dinoflagellates (Dinophyceae), 2 species were blue greens (Cyanophycea) and 1 species were green algae and a total of 19 species of zooplankton recorded in all twenty sampling points under 7 major groups were identified. The species, Chaetoceros compessus, Chaetoceros curvisetus, Coscinodiscus radiates, Coscinodiscus gigas, Nitzschia longissima, Planktoniella sol, Pleurosigma elongatum were occurred in twelve sampling points showed maximum spatial distribution and Navicula showed highest distribution in the harbor. The density of phytoplankton varied from 10,191 to 59,447 no/l. The density of zooplankton varied from 339.027 to 3057.248 no/l. comparatively, density of plankton were low in the harbor waters. Further details, Pl contact us
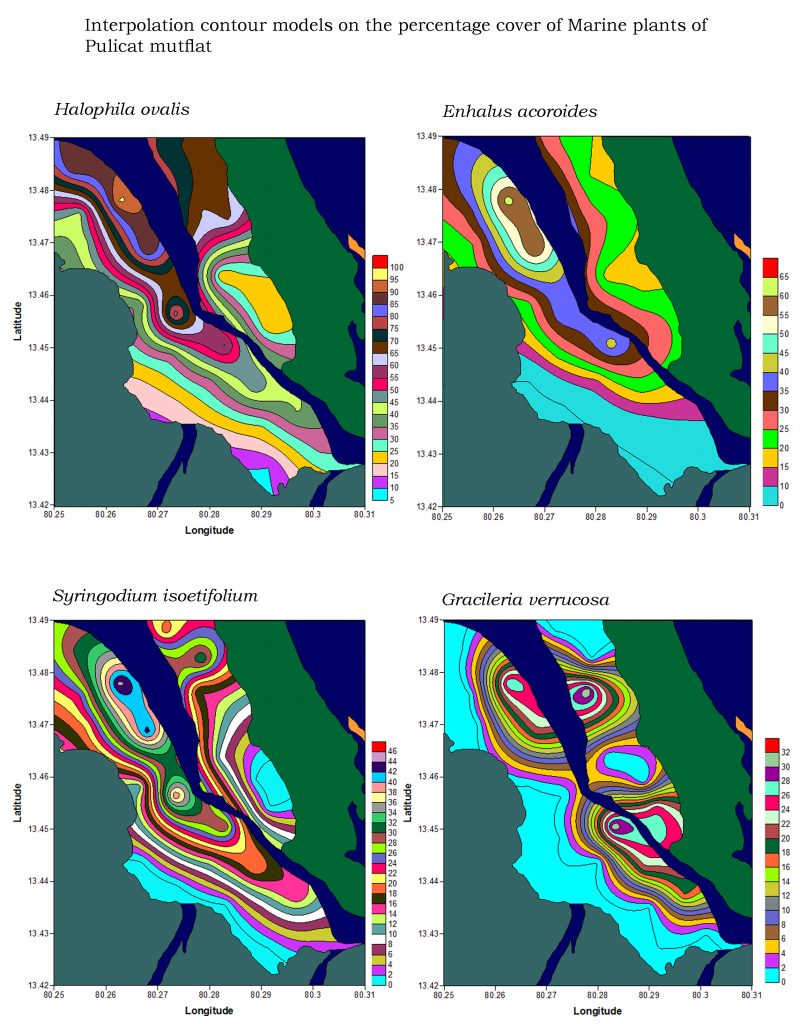 The following marine plants were observed and identified in Pulicat mudflat ecosystem. The seagrasses are Halophila ovalis (R.Br.) Hook, Syringodium isoetifolium (Asch) Dandy, Enhalus acoroides (L.F.) Royle, and seaweed Gracilaria verrucosa (Hudson). Occurrence study revealed that Halophila ovalis is the dominant species been observed in all stations. Enhalus acoroides has been observed in second dominant seagrass in the mudflat of Pulicat. Syringodium isoetifolium and Gracileria verrucosa were perceived 3rd and 4th dominant species. Study on growth and percentage cover revealed that Halophila ovalis has its unique character to occupy larger area in the study area. Enhalus acoroides is the second dominant species followed by Syringodium isoetifolium and Gracileria verrucosa. Enhalus acoroides yielded greaterbiomass followed by Halophila ovalis, Gracileria verrucosaI and Syringodium isoetifolium. The study area is subjected to moderate fluctuations in temperature from 29.2 – 32.5 oC. Salinity fluctuated from 21 to 36ppt. All marine plants except Halophila ovalis (also meager) in southern side of the mudflat are absent due to fresh water discharge nearby inhabitants. pH ranged from 7.1 to 7.5 and DO fluctuated from 3.1 and 4 mg/l. Nutrient supply seldom acts as a limiting factor in the abundance of marine plants. High content of nitrite in St 4 (14.03mg/l) and low value in St 18 (0.42mg/l) were observed. High amount of nitrate was recorded as 10.3mg/l (St.20) and low as 4 mg/l (St.6&7). Phosphate varied from 0.019 (St. 14) to 0.933 (St.5) mg/l. Silicate varied from 0.53 (St. 15) mg/l to 6.95 (St.12) mg/l.Organic carbon and organic matter can be formed by break down of fragments of seaweeds and sea grasses. In the present study, St 18 has identified to contribute less carbon/ matter and St. 15 contributed high content to the environment.
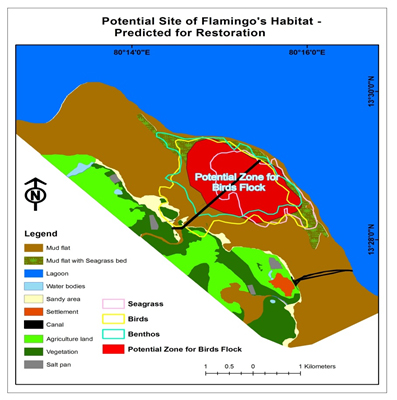 Study concluded that the distribution and feeding habit of flamingos could be controlled by tidal inundation, coastal plants (seaweeds and sea grasses), mudflat extension, benthic array and profile, temperature, salinity, pH and depth of water. GIS prediction map (Fig.11) was prepared based on the crucial factors for distribution to enhance the population in terms of restoration of habitat. As it is a potential study, Pulicat ecosystem need such studies to attract the migratory birds by extending the habitat with all preferred crucial factors in near future. Pl. contact us for further details.
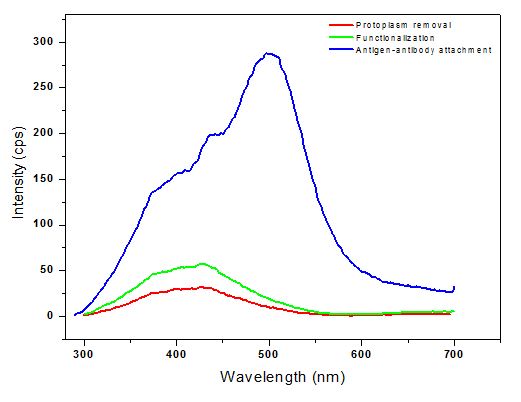 measuring the changes in the photoluminescence emission of diatoms frustules, the molecular recognition event between the antibody and its ligand has been monitored. The chemically modified diatom biosilica possessed intrinsic red PL spectra at 427 nm excitation. Once the antibody IgG has been attached to the diatom surface the excitement was peak at 497 nm. variation is the tool to act as diatom frustule as sensor. Further details, Pl contact us.
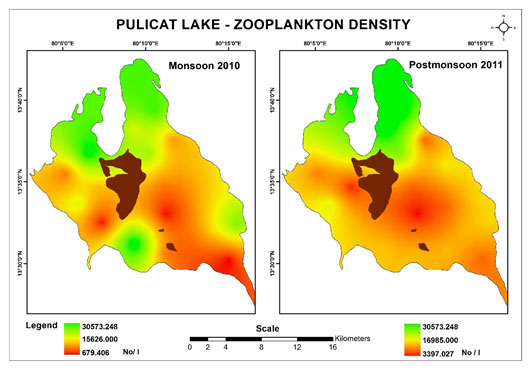 A total of 37 species of phytoplankton recorded during the present study in all twenty sampling points. Among them, 26 species were diatoms (Bacillariophyceae), 8 species were dinoflagellates (Dinophyceae), 2 species were blue greens (Cyanophycea) and 1 species were green algae. A total of 19 species of zooplankton recorded in all twenty sampling points under 7 major groups.The species, Chaetoceros compessus, Chaetoceros curvisetus, Coscinodiscus radiates, Coscinodiscus gigas, Nitzschia longissima, Planktoniella sol, Pleurosigma elongatum were occurred in twelve sampling points showed maximum spatial distribution and Navicula showed highest distribution in the Pulicat lake. The species of zooplankton, Favella sp, Acartia spinacuda, and Lucifer hanseni were noticed that they colonize and proliferate high numbers in Pulicat lake, where as the species, Globigerina sp, Sagitta elegans, Sagitta enflata, Pontella sp, macrosetella, microsetella, Oithona rigida were observed very meager in numbers. Station 1 and St. 2 were observed to have high proliferation of phytoplankton with the number of 13 and 12 species respectively. The density of phytoplankton varied from 1,01,910.828 to 5,94,479.8301 no/l in monsoon and 67940.55202 to 628450.1062 no/l in Postmonsoon season. The density of zooplankton varied from 3397.027 to 30573.248 (monsoon) and 679.4055 to 30573.248(Post monsoon) no/l. Among in different seasons, maximum species diversity (2.91) was observed in monsoon little lower in postomnsoon season of phytoplankton. Maximum species diversity (2.83) was observed in monsoon little lower in postomnsoon season of zooplankton.The study area is subjected to moderate fluctuations in temperature (29 – 32 in monsoon and 30.1 to 32.1in post monsoon oC). 20ppt is the minimum salinity in monsoon and maximum of 30ppt
 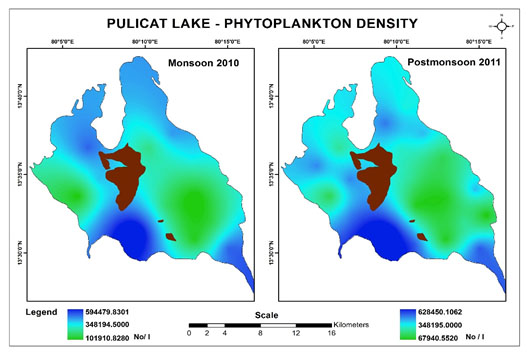 where as 31 is the minimum salinity in post monsoon and 34 is the maximum. Higher pH was recorded in St. 7 (monsoon), St. 1,15 16 (post monsoon)and lower pH noticed in St.12,14,17 (monsoon) and St.12 (post monsoon) of the Pulicat lagoon. Dissolved oxygen in the present study varied from 1.3 (St.5) to 5.6 mg/l (Fig.20) in monsoon and 2.4 (St. 13 and 15) to 3.5 (St.8) mg/l in Post monsoon. High content of nitrate in St 20 (both monsoon and post monsoon) and low value in St 6,7 (monsoon) St.3 (post monsoon) were observed in all stations. High amount of nitrite was recorded as 9.466 (monsoon) (St.13) 2.43 (post monsoon) (St. 20) µg/l and low as 0.106 and 0.095 µg/l (St.2) in both monsoon and post monsoon). Phosphate varied from 0.019 (St. 6) to 01.108 (St.20) µg/l in monsoon and post monsoon fluctuated between 0.03 (St.8) to 2.43 (St.17) µg/l. Silicate varied from 0.80 (St. 20) µg/l to 7.45 (St.6) µg/l in monsoon and varied from 0.02 (St. 1) µg/l to 4 (St.12) µg/l in post monsoon. Further details, Pl contact us.
 Nine species of brackish water lake inhabiting shrimps were identified from Pulicat. They are Penaeus indicus, Penaeus monodon, Penaeus semisulcatus, Penaeus merquiensis, Macrobrachium rosenbergii, Metapenaeus offinis, Metapenaeus dobsoni, Metapenaeus monoceros, Penaeus
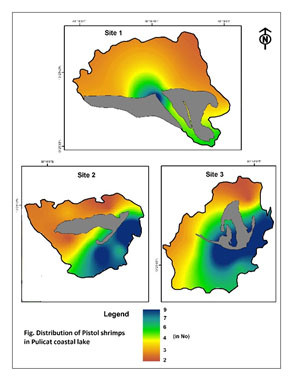 latisulcatus. There are two pistol shrimps were identified in Pulicat. All have been inhabited in dead oyster shell. They are Alpheus malabaricus, Alpheus heterochelis. Density of pistol shrimps varied from 3 to 7 no/sq.m in station 1. Higher density was noticed in sampling site 4 whereas lower density was found in 2 and 6. The pistol shrimps were varied in number from 2 to 9 No /sq. meter. Higher density was noticed in sampling site 1 whereas lower density number encounted in Site 2 and site 8. The pistol shrimps were varied in number from 2 to 8 /sq. meter. Higher density was noticed in sampling site 10 whereas lower density number encounted in Site 9. Weight of the pistol shrimp in different stations was shown that maximum growth rate was noticed in station 2 and lesser in St 2 (site 8) and St 3 (site 9). Density and weight of the oysters were high correlation with each other in terms of spatial contribution. Weight of the oysters were varied from 380 to 1650 grams in three sampling stations. The oysters in lowest weight was observed in station 3 and in site 9 whereas highest weight of the oyster was noticed in station 2 and in site 1.The density of oyster was observed to be varied from 2 to 9 No/ sq. m. lesser number of oysters were found in station 1 in site1, station 2 in site 7 and station 3 in site 8. Variation of temperature, Salinity and pH from 30 to 33 OC, 31 to 35ppt and 7.5 to 8.2