Geomorphology of Pulicat
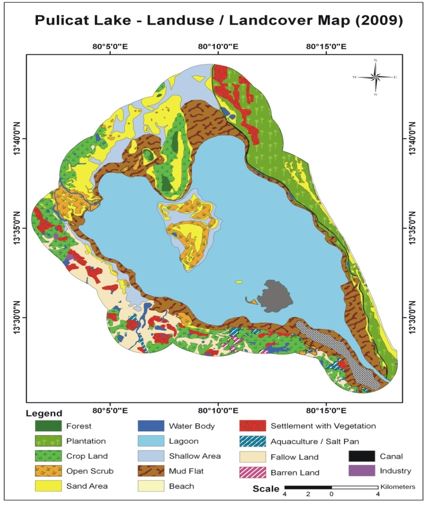 Pulicat lake is the second largest brackishwater lake in India and is located between 13o26’ and 13o43’N latitude and 80o03’ and 80o18’E longitudes. The recent estimation showed that the lake might have originated 6,660 years ago during the Holocene geological period. The dried parts of the lagoon is extend up to 13O60’ N latitude. The lake is lying almost parallel to the Bay of Bengal and opens to it through the south-eastern channel which is narrowest region near the Pulicat (Pazhaverkadu) village measuring about 250m. It covers an area of about 461 km2. The lake extends to about 59km from north to south direction with a maximum width of 19 km in east – west direction in the northern sector of the lake. The average depth of the lake is about 1.5m and the minimum and maximum depth varies between 0.5 to 6.0m respectively. Tidal fluctuation within the lake is 0.6m. The hydrodynamic characteristics of the lake are restricted to lagoon-ocean water exchange and seasonal positional switching of the entrance channel is the predominant issue. Within the lagoon, sediment may be transported by wind-induced waves and currents directed predominantly towards the northeast and west direction. The evaporation rate exceeds precipitation and runoff.Pulicat landuse and landcover map been prepared to evaluate the resources and its utilization. The land cover comprises forest area 0.9 sq km, mud flat 162 sq km, Plantation 92.7 sq km, sandy beach 17.7 sq km salt pan 0.07 sq km, water body 139 sq km. The mudflat spreads are higher next to water holding area in the lake. The vast mudflat area, around the lake is an ideal feeding ground for migratory birds as it supports rich assemblage of seaweeds and sea grasses. Barren mudflats have high potential to arise the mangrove plants with participatory approach. Shell mining is the serious threat to the resources and alteration of habitat in the lagoon of Pulicat.
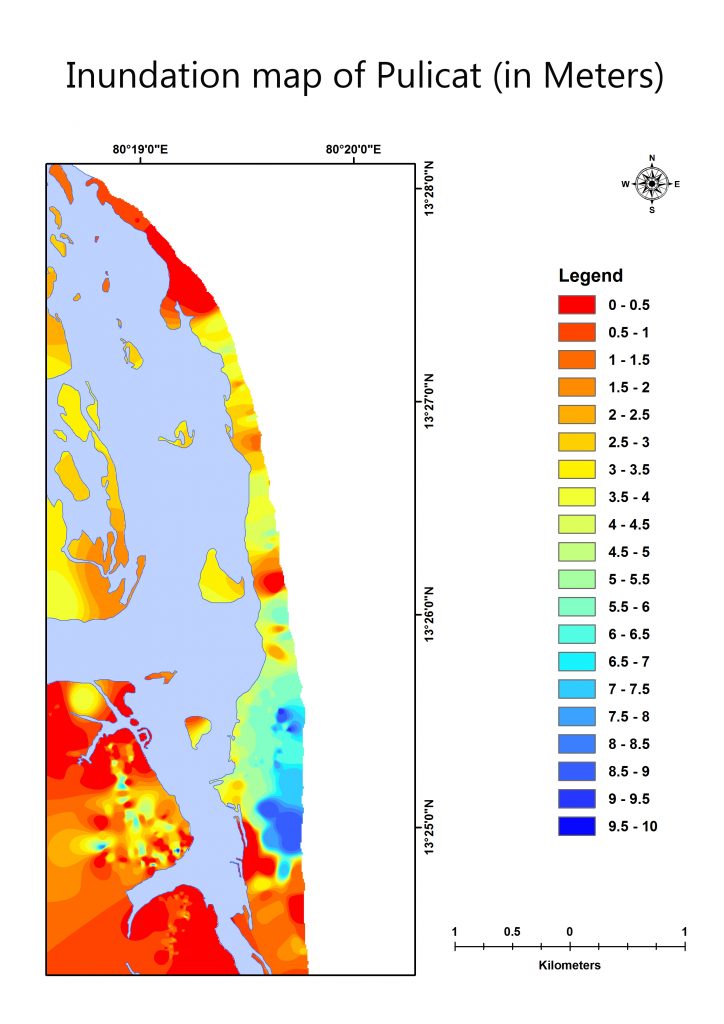 The present study has generated results helped to carry out tsunami vulnerability assessment. Map represents the submergence level of study area from 0-10 m. If the water level rises from 0-0.5m can cause submergence along Pulicat settlement, jamilapath and saathankuppam village. These two areas are highly prone to inundation. And near to the mouth region is also submersible when the water level rise as 0-0.5m. If the water level rises from 0.5-1 m can cause submergence extended to saathankuppam village and Pulicat settlement and mouth region. If the water level rises up to 1-1.5m, the region adjutant to the back water of Pulicat and saathankupam village, karimanal village can be easily submersed.
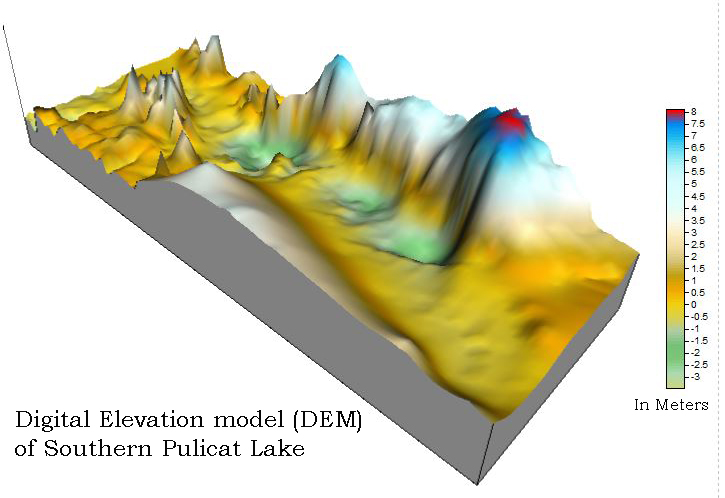 the water level rises up to 3-3.5m it makes inundation along the land area of Pulicat and area which is near to the lake in Northern side. 3.5-4m water level rises can cause submergence along the Pulicat and in adjustant to lake and lighthouse kuppam. 4-4.5m of water level rises can cause inundation along settlement area of Lighthouse kuppam. If the water level rises up to 4.5-5m, the karimanl village and the Nakathur village would be submerged. 5-6m water level raises would inundate along the Nakathur village. 6-7m, represents the submergence level adjustant to Nakathur village. If the water level rises up to 7-7.5 m which cause inundation near vairavam kuppam and 7.5-8m water level rises can inundate the settlement area of vairava kuppam. If the water level rises up to 8-10m, the Vairavan kuppam and adjutant to karangali village can be easily submersed. The highly elevated area was observed in vairavam kuppam and the lowest area was noticed in saathankuppam and jamilabath village which are highly prone for the tsunami waves. These villages can be easily submerged even if the water level rises up to 0.5m.
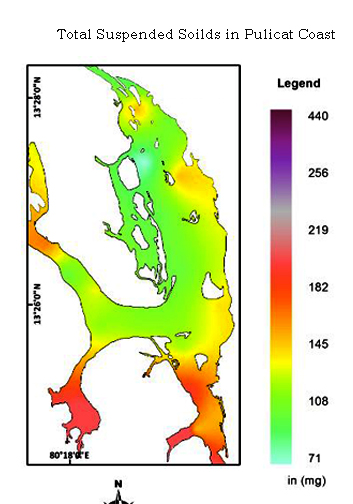 Total suspended solids were measured in the flushing channel of Pulicat between lake and sea. In November 2013, suspended solids were noticed higher in st.7 (241mg/l) lower in St.13 (153mg/l). In December 2013, suspended solids were recorded to be higher in St.1 (436 mg/l) and least level in St. 8 (154 mg/l). In the month of January 2014, suspended particles were higher in St.5 (195mg/l) and lower in St. 12 (72 mg/l). High amount of suspended particles in all stations were observed in November 2013 (4206 mg/l), followed by December 2013 (4060 mg/l) and January 2014 (2197 mg/l). However, in December, 2013 at St.1 to be identified as higher suspended load site (436mg/l). Interpolation contour models showed that suspended load in the month of November
 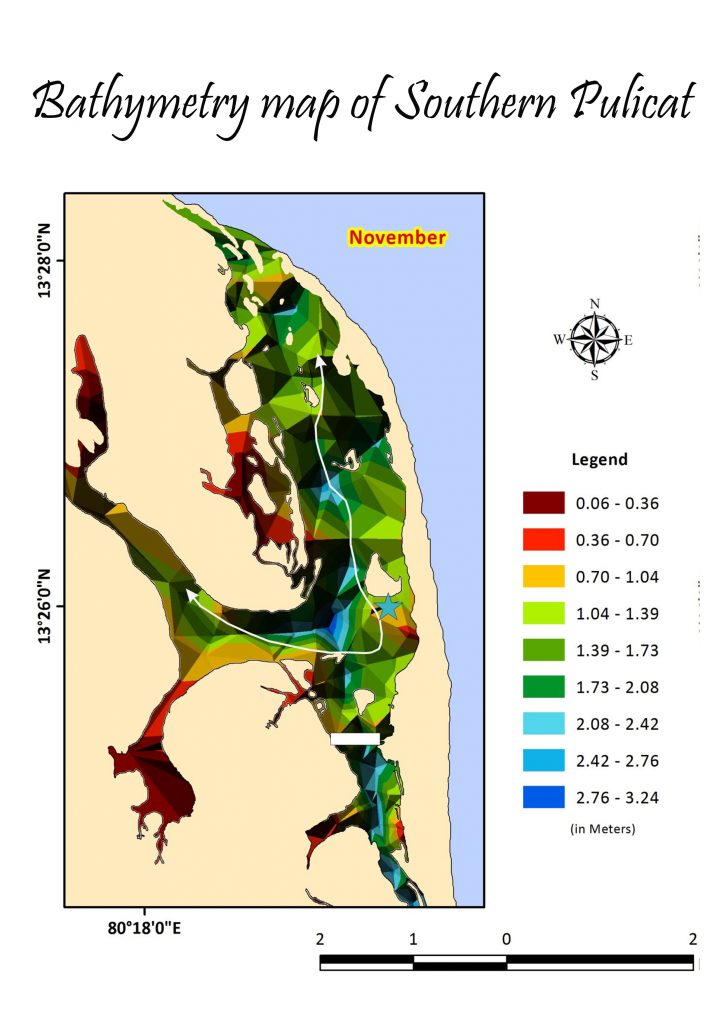 and December (monsoon season) has higher both spatially and quantitatively. Nevertheless, suspended particles in November were higher from mouth to inner lake of the flushing channel and in December, particles were less in distribution but greater in quantitatively in chosen stations. As per the water movement which cause erosion and accretion and particle settlement in the lake, bathymetry being determined. Bathymetry mapping both DEM and interpolation contour models showed that western side of the St 7 found to be higher depth caused by water current induced erosion. Most of the parts in flushing channel of Pulicat noticed as shallow regions. Some pocket regions in Northern and Southern part of flusing channel seems to be high depth which investigated clearly in the bathymery maps. Bethymetry in January showed the reducion of depth might be less water current caused accretion. During November 2013, 30 tonnes of sediments carried by low tide water flushing towards sea and 27 tonnes carried towards lake by high water is the highest transaction (Table 2). Three tonnes of sediment carried into sea by net transport migration. It was reduced in January as 1.5 tonnes. the suspended particle transport was higher in monsoon and reduced in Post monsoon and highly depends on the fresh water run off and river water which carries particle by Kalangi river.
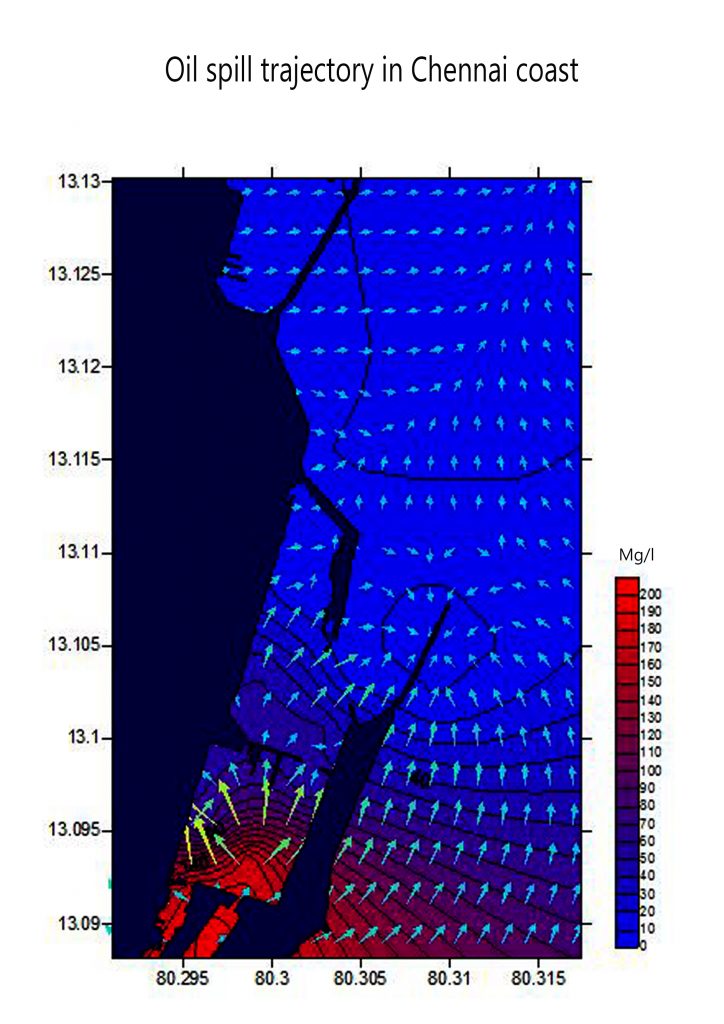 er would be lower inside the harbor. Depth of the harbour was varied from 75 to 1450 cm in the present study. Present study revealed that depth never play major role in the trajectory of spill. Salinity in all the stations was extreme of 31 ppt and lower of 39ppt. Hike was noticed inside the harbor showed high correlation with temperature due to absence of visiting tidal waters caused higher salinity. The pH fluctuated between from 8.1 to 9. The pH recorded fully alkaline. The results showed that one isolates were short Gram Negative rods, Pseudomonas and coma shaped negative rods vibrio and the other isolate were Gram Positive cocci , Staphylococcus sp. The colonies Golden yellow colour colonies were observed in mannitol salt agar. Gram positive cocci in clusters were observed in Grams staining. Nutrient agar-Pseudomonas – Green colour colonies were observed. Gram negative short rods were observed in Grams staining Tcbs – Vibrio – Yellow colour colonies were observed. Comma shaped gram negative rods were observed in Grams staining.18 species were diatoms (Bacillariophyceae), 8 species were dinoflagellates (Dinophyceae), 2 species were blue greens (Cyanophycea) and 1 species were green algae and a total of 19 species of zooplankton recorded in all twenty sampling points under 7 major groups were identified. The species, Chaetoceros compessus, Chaetoceros curvisetus, Coscinodiscus radiates, Coscinodiscus gigas, Nitzschia longissima, Planktoniella sol, Pleurosigma elongatum were occurred in twelve sampling points showed maximum spatial distribution and Navicula showed highest distribution in the harbor. The density of phytoplankton varied from 10,191 to 59,447 no/l. The density of zooplankton varied from 339.027 to 3057.248 no/l. comparatively, density of plankton were low in the harbor waters. Further details, Pl contact us